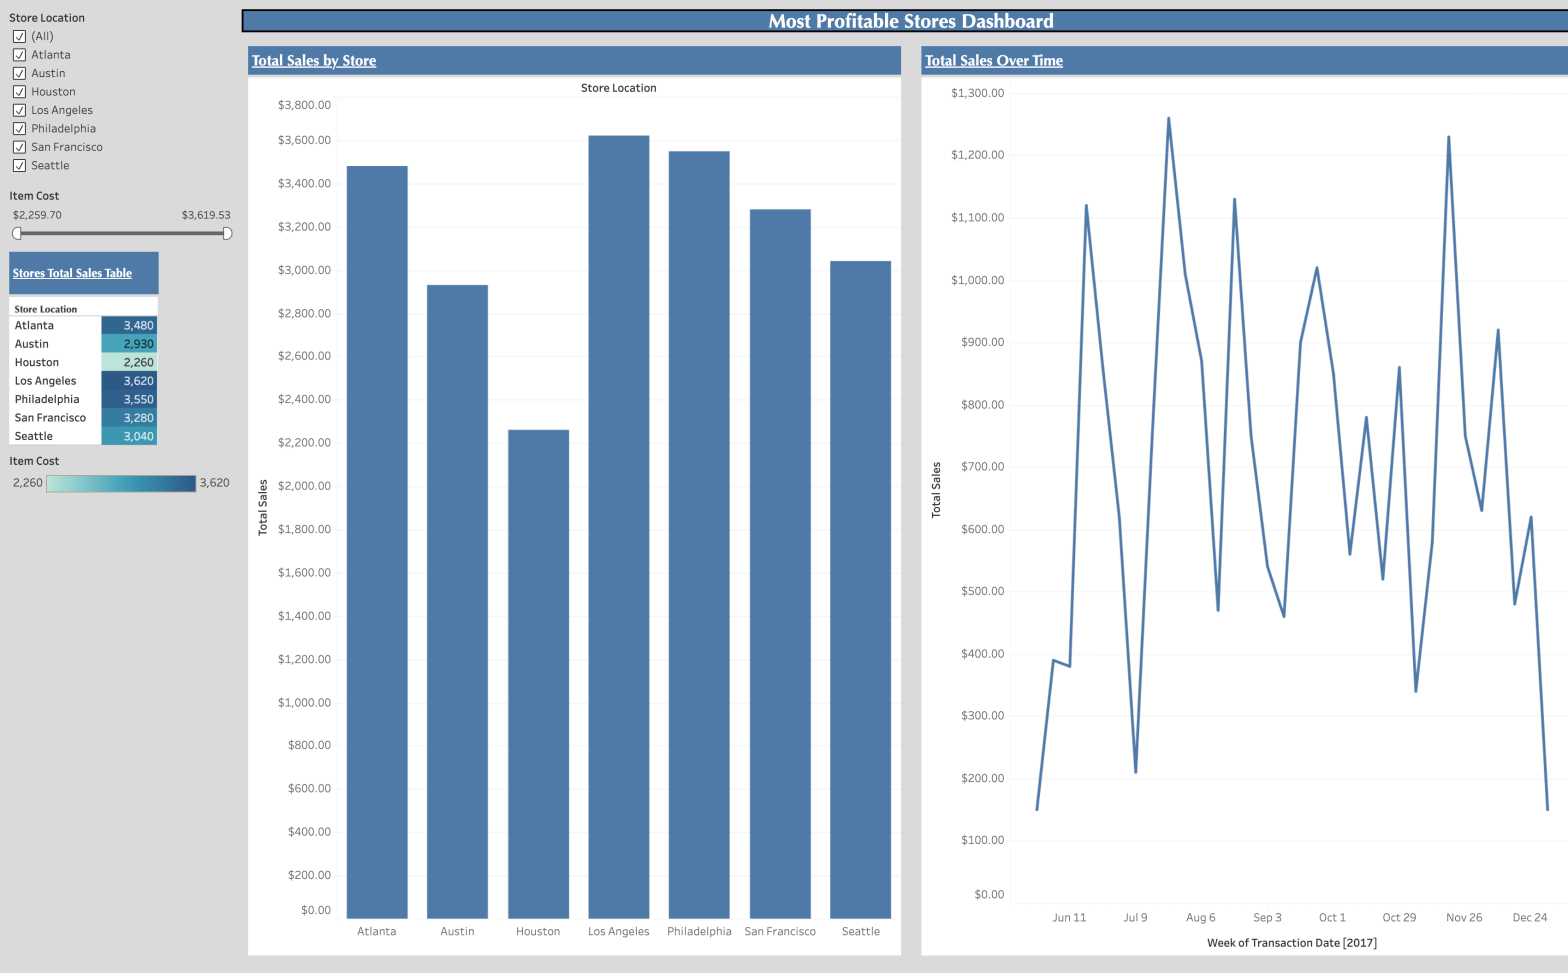
This project presents an interactive Tableau dashboard designed to evaluate store-level sales performance and identify the most profitable locations across the organization. By visualizing total sales by store alongside sales trends over time, the dashboard enables stakeholders to quickly compare performance across locations and understand how revenue fluctuates throughout the reporting period.
The analysis supports data-driven decision-making by highlighting relative store profitability and underlying cost dynamics through interactive filters. Users can explore how sales performance varies by location and cost range, making the dashboard a practical tool for performance monitoring, operational review, and strategic planning.
To interact with the dashboard, click the link below:
https://public.tableau.com/app/profile/anthony.dahl/viz/MostProfitableStoresDashboard_17206237962350/MostProfitableStoresDashboard?publish=yes